433 were finished in the last 12 months.
Berkeley’s housing pipeline — application, approval, building permit, move-in day — independently reconstructed from the City’s own records.
See every project as squares, 10 homes each
See Berkeley’s permit pipeline — 11,442 units not yet built, 4,368 built since 2018 →
See 1,547 Berkeley building projects →
11 flights along Berkeley’s corridors in Google Earth, every project drawn as a colored block and labeled as the camera reaches it.
▶ Play all 11 flyovers, one after another, full screen
All tours, with map and Street View →

What the building colors mean
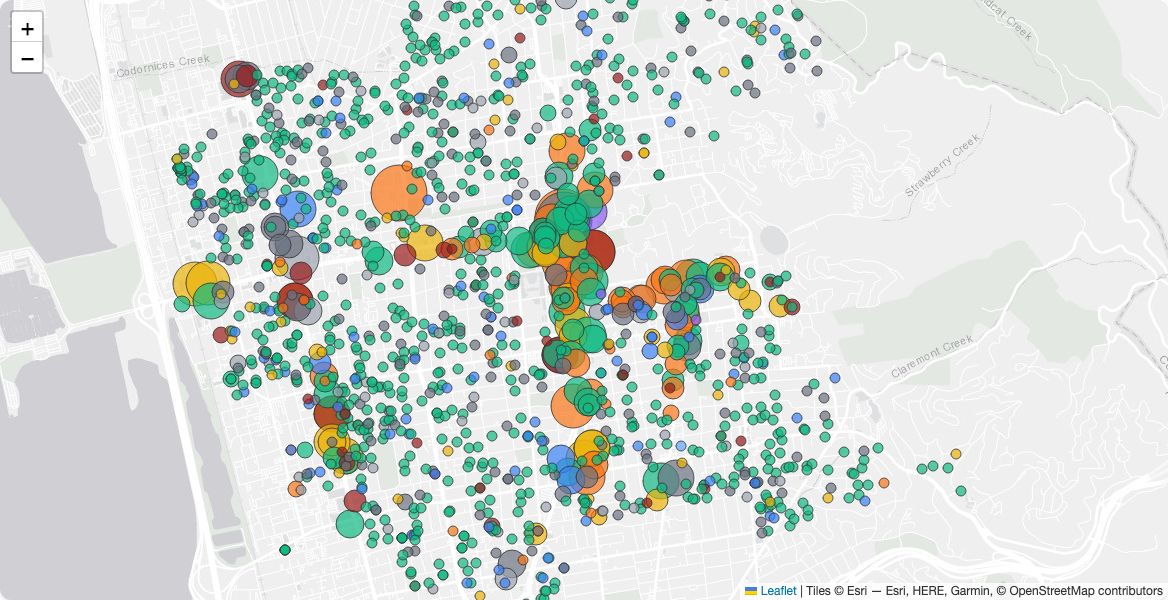
Color shows where each project stands: gray at pre-application · yellow under review · orange entitled (approved, no building permit yet) · cyan permitted, not yet started · blue under construction · green completed and occupiable · red stalled · dark red withdrawn. Warm colors are paper stages, cool colors are physical ones. A thick outline marks a project permitted by its own agency rather than by the City — purple for UC Berkeley and magenta for BART joint development; the fill still shows the stage. Elsewhere on BerkeleyBuild.com: the architects’ own plan sets and the affordability tabulations filed with them, and for every project in the pipeline the full permit timeline — when it was filed, when it was approved, when the building permit issued, and when it was finished.
Check the Pipeline Explorer Projects tab to see the architects’ own plan sets and the affordability tabulations filed with them, and for every project in the pipeline the full permit timeline — when it was filed, when it was approved, when the building permit issued, and when it was finished.
Bancroft Way — Piedmont to Aquatic Park
The future of Bancroft Way, east to west: from Piedmont Avenue at the campus edge, through downtown, and out across the flats to Aquatic Park. Thirty buildings, each labeled as the camera reaches it — its address, how many homes, how many stories and how tall, who is developing it and who owns the land. Together they are 3,690 units, of which 1,625 are student beds in the UC tower rising at Bancroft and Fulton, leaving 2,065 homes. Only 9% is built: 325 units are finished and occupiable, while 1,182 are entitled — approved, with no building permit yet pulled — and 1,730 are under construction, nearly all of them that one UC tower. The flight orbits three buildings on the way: 2530 Bancroft, 2200 Bancroft, and 2276 Shattuck. Current to September 2026.
Telegraph Avenue — Woolsey north to UC Berkeley
The future of Telegraph Avenue, south to north: from Woolsey Street at the Oakland line, up past Ashby and Dwight, through the Southside blocks below campus, to the UC Berkeley edge at Bancroft. Seventeen buildings, each labeled as the camera reaches it — its address, how many homes, how many stories and how tall, who is developing it and who owns the land. Together they are 905 units. Only 29% is built: 261 units are finished and occupiable, while 324 are entitled — approved, with no building permit yet pulled — 177 are still in review, and 91 are under construction. A further 52 units were withdrawn. The largest single project on the street is 3030 Telegraph at 144 units, completed in January 2026, and the flight makes a full orbit of it on the way north. At Dwight the camera follows the dog-leg the avenue itself makes through the intersection. Current to September 2026.
UC Berkeley Student Housing — 5,010 Beds in Four Projects
Four UC Berkeley student housing projects, flown north to south: 1950 Oxford — Anchor House — 772 beds and complete; 2200 Bancroft, 1,625 beds and under construction, which at 23 stories and 263 feet will be one of the tallest buildings in Berkeley — and, when it opens in 2027, the tallest completed one, though still shorter than the Campanile at 307 feet; 2556 Haste at People’s Park, 1,113 beds and under construction; and the Anna Head site at 2400 Bowditch, more than 1,500 beds and still at pre-application. Together at least 5,010 beds. People’s Park adds a second building beyond that count: roughly 100 permanent supportive and affordable apartments, run by Satellite Affordable Housing Associates, which begin construction only after the student building opens in autumn 2027. UC housing is counted in beds rather than units, because the University builds rooms, not apartments. These projects are exempt from city permitting — the Regents approve them and the University issues its own building permits — so none of them appears in Berkeley’s permit system or counts toward the city’s state housing targets. The flight opens east of the Campanile, spirals down once around each building, and closes climbing west over the campus.
Shattuck Avenue — South to North, past the towers
The future of Shattuck Avenue, south to north: from Woolsey Street through downtown to Rose. Sixty buildings, each labeled as the camera reaches it — its address, how many homes, how many stories and how tall, who is developing it and who owns the land. Together they are 9,347 units, of which 2,397 are UC student beds, leaving 6,950 homes along a single street. Only 23% of that is built: 2,147 units are finished and occupiable, while 3,585 are entitled — approved, with no building permit yet pulled — and another 1,673 are still in review. The flight makes 360° orbits of the four largest: 2700 Shattuck at 359 units, 2276 Shattuck at 336, and the two tallest towers in Berkeley’s pipeline, 2190 Shattuck at 110 m and 452 units, and 1974 Shattuck at 98 m and 599 units. Current to September 2026.
University Avenue — Berkeley Harbor to UC Berkeley at Oxford Street
The full length of University Avenue, west to east: from the Berkeley Harbor, over the freeway and across the flats, through downtown to the campus gate at Oxford Street. Every building in the housing pipeline along the way, with 360° orbits of the four largest — 1581, 1598 and 2029 University, and the 599-unit tower at 1974 Shattuck. Heights are taken from each project’s own filings, and street names are labeled at every crossing.
Durant Avenue — Milvia to Piedmont
Durant Avenue west to east, from Milvia Street to Piedmont Avenue, one block south of the campus edge. The flight orbits three buildings on the way: 2425 Durant, 117 units and entitled; 2538 Durant, 83 units and completed; and the 1,625-bed UC tower rising at 2200 Bancroft, which at 23 stories will be one of the tallest buildings in Berkeley, and the tallest completed one when it opens in 2027. Six projects sit on Durant itself, from 2037 at the west end to 2538 at the east; a block either side, the downtown Shattuck towers and the UC dormitories bring the total in view to roughly 2,500 homes and 3,100 student beds. Heights come from each project’s own filings, and street names are labeled at every crossing.
San Pablo Avenue — North to South
San Pablo Avenue down the length of west Berkeley, north to south, 2.3 miles from the Albany line to the Oakland border. The flight orbits four: 2136 San Pablo, 125 units and entitled; 2198, 100 units and entitled; 2601, 223 units and in review; and 2733, 152 units and in review. Eighteen projects line the avenue, 1,056 homes in all — but only 157 of them are finished. Twelve of the eighteen are still on paper: 568 units under review, another 241 entitled but not yet permitted. That is what makes this corridor look different from downtown in the air — the warm colors of the paper stages dominate a street where almost nothing has been built yet.
Patrick Kennedy & Panoramic Interests — 35 Years of Berkeley Housing
A flyby of every Berkeley building by Patrick Kennedy's Panoramic Interests, 1990–2028 — from the 6-unit Henry Court to the proposed tower at 2274 Shattuck. Twenty-three buildings, twenty-one of them housing: 699 homes built across three decades, with 360° orbits of the largest projects. The other two are here because this is one developer’s entire Berkeley output rather than a housing list — a self-storage building from 2006, and a 2009 historic renovation on Center Street.
June 2026 Shattuck Avenue Building Pipeline
June, 2026 Shattuck Avenue building pipeline: all projects Entitled or In Review.
2026 Berkeley's 17 Largest Private Housing Projects
Video flyby of the 17 largest private housing projects in Berkeley, each with over 200 units planned.
Elmwood Future At Seven Base Stories
A hypothetical scenario, not projects in the pipeline. An orbit of eight College Avenue sites in the Elmwood, drawn at 7 stories: the 5-story base the Planning Commission recommended in May 2026, plus a state density bonus. Four of them — the 7-Eleven at 2887 College, 2901 College, 2999 College and the post office lot at Webster Street — are on the Mixed-Use Opportunity Areas map the Commission adopted; the other four are not. These buildings are not colored by stage.
Every project on one map, colored by where it stands. Circle size is the number of homes.
 Open the map →
The developers, architects, owners and applicants on the record of Berkeley’s major projects, joined where they share a project. Click any name to see its projects.
 Meet the players →
Everything behind the numbers, open to check.
More homes, healthy neighborhoods: what Berkeley's own records say works.